When you hear that the market is up or down — on the car radio or around the water cooler — what does that really mean? More often than not, it reflects movement in the two most well-known stock market indexes, the Dow Jones Industrial Average and the Standard & Poor’s 500, which tend to move more or less in sync.
In fact, there are hundreds of indexes that track various categories of investments. Here are a few that are commonly cited and may be used as benchmarks for investments you own or are considering.
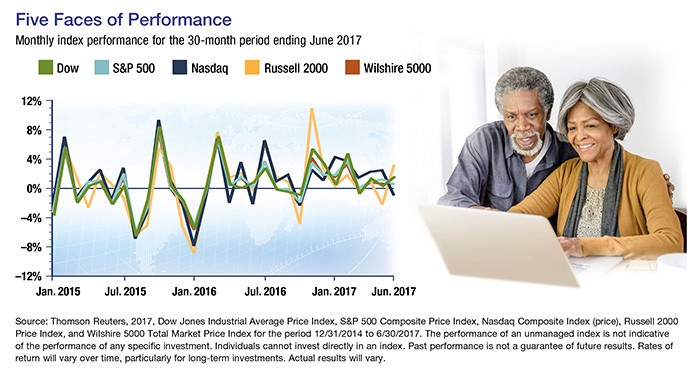
Dow Jones Industrial Average® — tracks stocks of 30 large, well-known U.S. companies across a variety of business sectors. Originally a true average of stock prices, it now uses a divisor to adjust for stock splits, distributions, and substitutions — making it a price-weighted index rather than a true average.1
Unlike the Dow, the following indexes are weighted based on market capitalization, the value of a stock’s outstanding shares. Market-cap-weighted indexes tend to be skewed toward the performance of the larger companies in the index.
S&P 500® — tracks a much broader range of large U.S. companies (large caps) than the Dow and is often considered representative of the U.S. stock market in general. However, it does not capture midsize companies (mid caps) or small companies (small caps), which carry higher risk and higher growth potential than large companies and are tracked by the S&P MidCap 400® and S&P Small Cap 600®, respectively. The number of stocks in S&P indexes may vary slightly from the number indicated in the name.2
Nasdaq Composite Index® — represents more than 2,500 equities traded on the Nasdaq Stock Market. The Nasdaq Composite includes technology companies of all sizes and a variety of smaller companies, and comprises both U.S. and foreign stocks. In general, its components tend to carry higher growth potential but greater risk than the large domestic stocks tracked by the Dow and the S&P 500.3
Russell 2000® Index — tracks stocks of the 2,000 smallest companies in the Russell 3000® Index (the Russell 1000® Index tracks the 1,000 largest). The Russell 2000 is the most widely used benchmark for U.S. small-cap stocks.4
Wilshire 5000 Total Market IndexSM — tracks the performance of all U.S. stocks with readily available price data, and thus is the broadest measure of the U.S. stock market. When established in 1974, the index was composed of around 5,000 stocks. It grew to more than 7,500 stocks in 1998, but since then has dropped steadily, largely due to corporate consolidation; the index included about 3,600 stocks as of mid 2017.5
The performance of an unmanaged index is not indicative of the performance of any specific security, and individuals cannot invest directly in an index. Past performance is not a guarantee of future results. Actual results will vary.
All investments are subject to market fluctuation, risk, and loss of principal. Shares, when sold, may be worth more or less than their original cost. Investing internationally carries additional risks such as differences in financial reporting, currency exchange risk, as well as economic and political risk unique to the specific country. This may result in greater share price volatility.